Skip to content
← Back to the overview
LAVA / TECHNICAL DETAILS

Behind the prediction.

Inspect the investigation loop, permission design, two-curve logic and spatial integration concept. Explore the stored model example along the way.

SYSTEM DESIGN / THE INVESTIGATION LOOP

How does a question
become a sourced answer?

Select a step to inspect its role. This diagram explains the agent workflow; it is not a live execution log.

LAVA AgentQuestion → evidence → review
↺ Follow-up investigation
01 / FRAME

Define the question

Start with the selected region or support record. Establish what the engineer is trying to understand before choosing a tool.

Structured evidence CSV records · stored model outputs

Document evidence Approved papers · rules · original documents
The longer project cycle

Site records → model evaluation → engineering review → new observations → reviewed updates

Continuous updates and model lifecycle controls are an integration direction. The static preview uses frozen records and prepared responses.
GOVERNANCE DESIGN / ROLES & RESPONSIBILITIES

Who can change what?

Explore the proposed production roles. These describe the governance design; this public preview does not enforce a site permission system.

Review engineering inputs with a recorded rationale.

  • Review geological evidence and authorised RRI revisions.
  • Assess the result against applicable site criteria.
  • Record a revision as a new evaluation with its evidence trail.

A new assessment retains the original result; it does not overwrite the frozen research record.

Flags remain visible.

An optimistic explanation cannot remove the original screening flag. A review decision and a stored model result are separate records.

Sources remain identifiable.

A water record, an RRI assignment, a site policy and a research method each have their own provenance. Missing evidence stays explicit.

Access has a scope.

Production permissions should account for role, site and field. Read access, proposed revisions and approved changes are distinct actions.

SPATIAL CONTEXT / INTEGRATION CONCEPT

Give the result
a place in the picture.

Connect a support-level question to its surroundings. Explore how a future digital-twin integration could bring records, assessments and spatial models together.

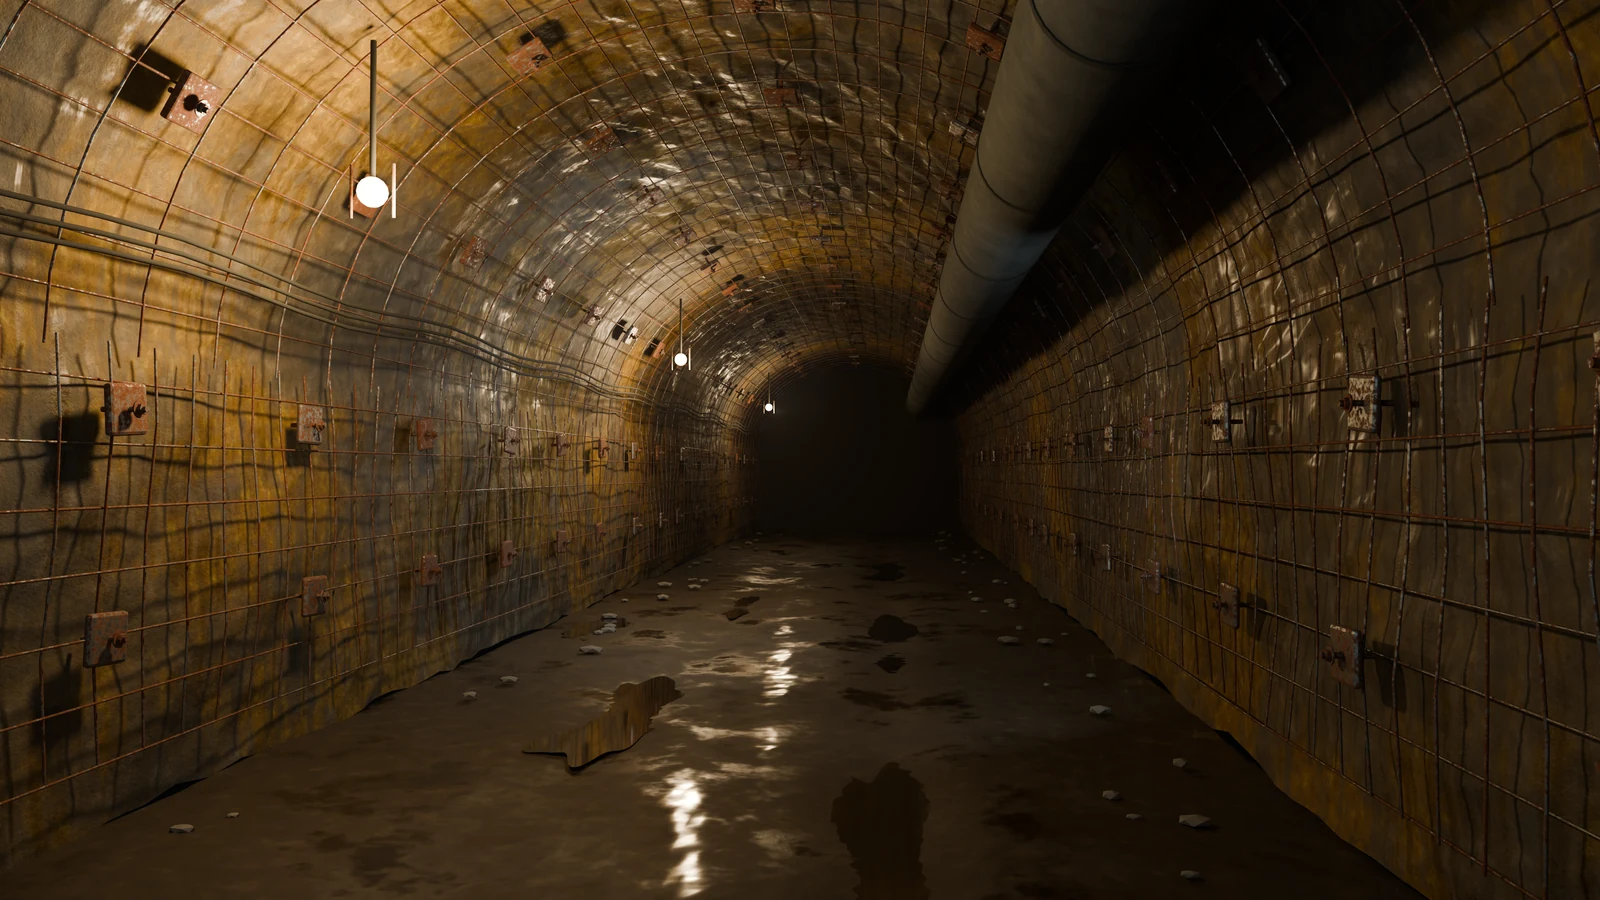
Synthetic 3D tunnel with support mesh, bolt plates, service pipes and a wet floor.
Synthetic 3D sceneIllustrative geometry · no live telemetry

Tunnel overview

See the support system within an illustrative underground setting. This locally rendered scene is not a surveyed mine, an inspection photograph or a spatial prediction of corrosion. A real integration would require verified asset identifiers, spatial alignment and governed site records.

01 / UNDERSTANDING THE METHOD

Corrosion affects more
than strength alone.

A corroded support can retain much of its static capacity while losing its ability to deform before breaking. LAVA keeps both responses visible so that one reassuring number does not hide another concern.

01 / COMPONENT MODELS

Different changes. Different learners.

XGBoost estimates the section-loss proxy and total-elongation loss. Gaussian-process regression estimates ultimate-strength loss. These models learn distinct material responses from the study data.

Environmental inputs include a site-specific chemistry score and a pre-assigned Rock Reactivity Index. Age, material and matched controls provide the context for interpreting the result.

02 / TWO BRANCHES

Keep strength and deformation visible.

The static branch combines section loss and ultimate-strength loss. The ductility branch tracks elongation loss: how much ability to stretch before breaking has been lost.

Displayed static reserve = 100 − section loss − strength loss. Ductility reserve = 100 − elongation loss. Elongation is a material indicator, not a direct measurement of an installed system’s energy absorption.

03 / TWO REVIEW FLAGS

Show which response needs attention.

The demonstration compares static reserve with 66% and ductility reserve with a provisional 70% sensitivity screen. Each branch keeps its own flag; they are not averaged into a reassuring overall score.

A flag prompts review. These thresholds are not universal site limits, and a flag is not a probability of failure. Copilot can explain a result but cannot change the value or clear its flag.

Explore the source-linked explanations
02 EXPLORE THE CASE

One region.
Two different signals.

Select a synthetic region and move through its stored results. See which branch draws attention—and why.

Interactive research example

Research models. Synthetic demonstration data.

Screening indicators support review. They are not probabilities of failure or site acceptance decisions.

03 THE RESEARCH FOUNDATION

A method you
can examine.

The accepted ICONIP 2026 research examines site-specific rock-bolt corrosion screening. Separate component models make the contribution of section, strength and elongation losses visible.

Explore the public method explanations
211

Tested specimens in the research cohort203 recovered specimens + 8 as-manufactured controls

3 → 2

Component responses, two screening branchesSection loss · strength loss · elongation loss

Traceable

Sources alongside explanationsResearch evidence and product demonstration kept distinct

Research scope & demonstration boundaries +

The research evaluation is internal, post-selection and specific to its study cohort. It does not establish independent validation at other mines or in tunnels. A new site requires a separate assessment of data, materials, exposure and engineering criteria.

The eight preview cases use selected CTGAN synthetic inputs and stored outputs from frozen research models. The optional shaded bands represent input sensitivity, not calibrated prediction intervals. Copilot examples are prepared responses; this public preview runs no live Agent.

LAVA was developed by Joe (Chuning) Zhou with historical data, engineering expertise and manuscript review contributed by Professor Bre-Anne Sainsbury. The software demonstration and its business workflow extend beyond the paper’s model evaluation.

04 FROM DEMONSTRATION TO YOUR WORKFLOW

Start with the question.
Build around your evidence.

A useful pilot begins with your engineering problem and the records you already have. Together, we can define what needs to be demonstrated.

01 / UNDERSTAND

Map the workflow.

Identify the review task, the people involved and the information that is difficult to bring together.

02 / ASSESS

Establish the data fit.

Review record types, quality and permissions. Agree on the site-specific assumptions and evidence gaps.

03 / EVALUATE

Test something useful.

Define a limited prototype or retrospective study, with agreed measures of traceability, review effort and decision support.

LET’S TALK ENGINEERING

What would make this
useful to your team?

Bring a workflow, a difficult question or a set of records.
Let’s explore where an evidence-led tool could help.